
Ready-Made Chart of Accounts Excel Template for Saudi Businesses
A ready-made chart of accounts Excel template with five groups, expandable numbering and separate VAT accounts, plus five steps to build your own chart from it.
Author:سامي الحيدري
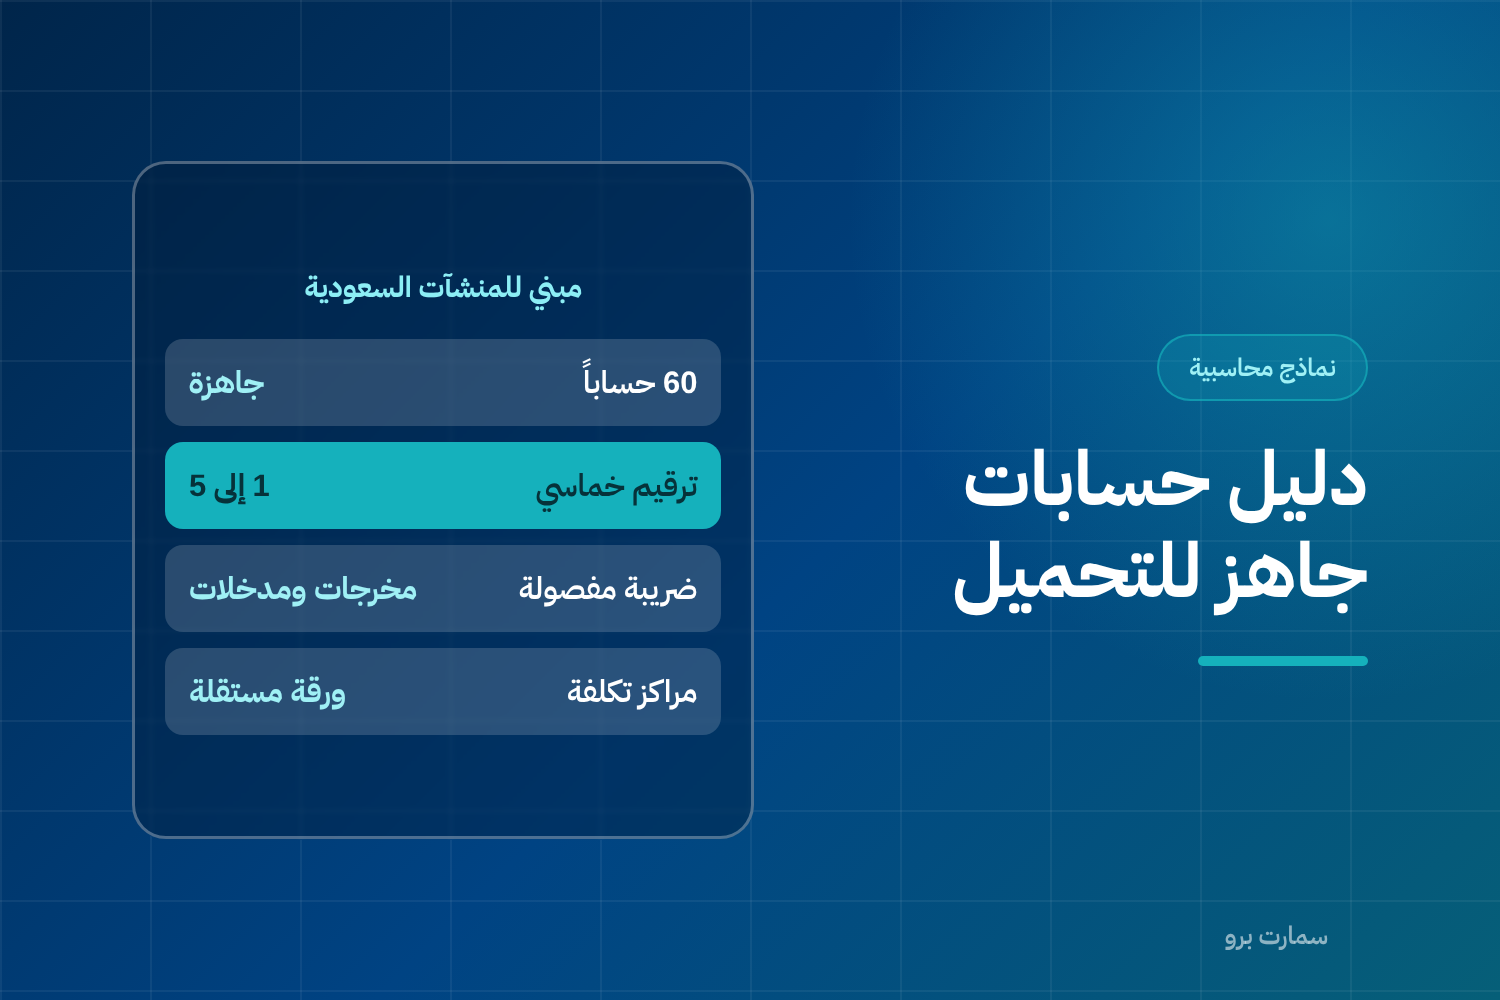
A ready-made chart of accounts Excel template is the fastest way to get started instead of building from a blank sheet. A chart of accounts is the list of every account your business records transactions in, organised and numbered in five groups. This template gives you a starting chart that you adapt to your business.
Download it, delete what doesn't apply to you, and add what's missing, instead of starting from a blank sheet.
What does the ready-made chart of accounts Excel template include?
- User guide: the rules for building the chart and the mistakes that ruin it.
- Chart of accounts: 60 accounts with their numbers, groups and normal balances, plus notes on every account that needs attention.
- Cost centres: a separate sheet for branches, projects and departments.
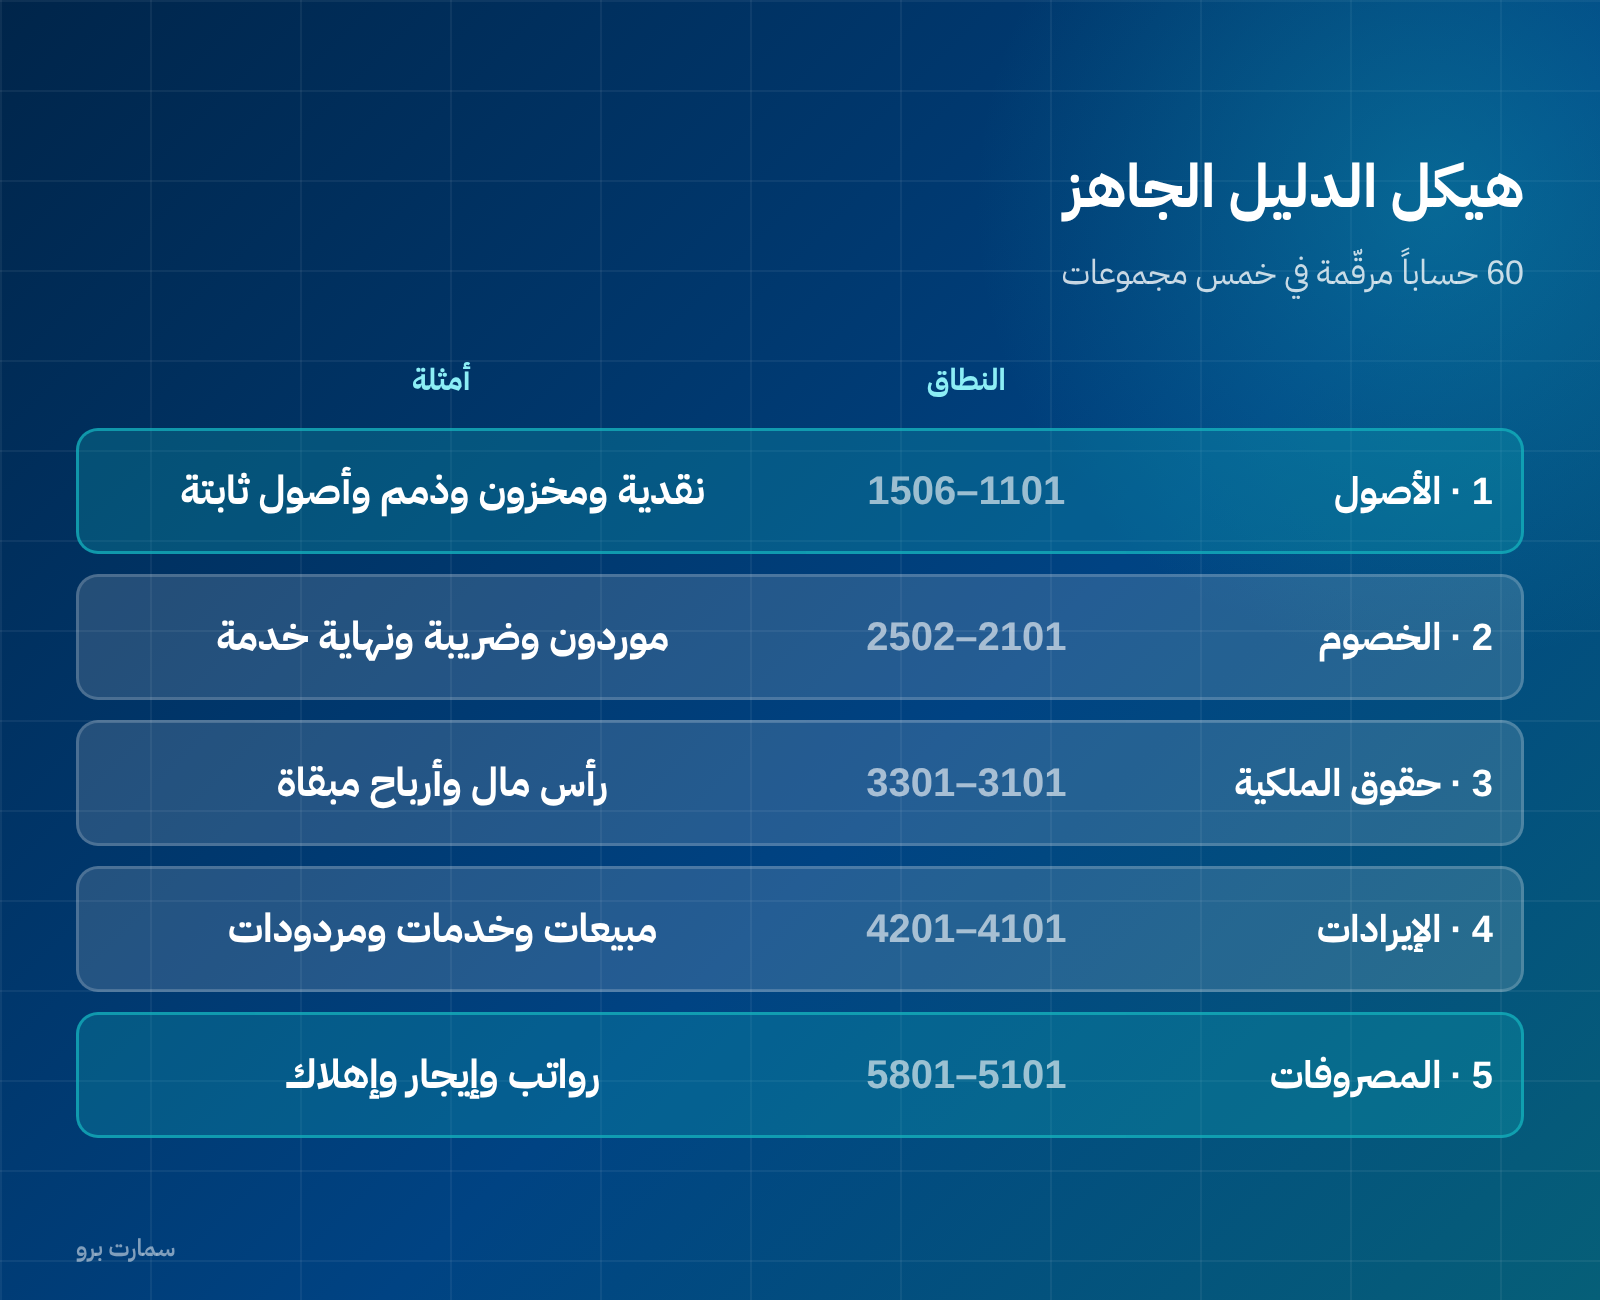
Numbering: five groups
- 1 Assets (1101 to 1506): cash, banks, receivables, inventory, fixed assets and accumulated depreciation.
- 2 Liabilities (2101 to 2502): suppliers, accrued expenses, deposits, VAT, end-of-service provision and loans.
- 3 Equity (3101 to 3301): capital, partners' current accounts, retained earnings and drawings.
- 4 Revenue (4101 to 4201): sales, service revenue, returns and discounts allowed.
- 5 Expenses (5101 to 5801): cost of goods sold, salaries, rent, marketing and depreciation.
This order is the same order in which accounts appear in your financial statements, and it lets any new accountant understand your books within minutes.
What rule decides how big the chart should be?
Open a separate account only if you will make a decision based on its balance.
A small business runs efficiently with 40 to 70 accounts. One that opens 300 accounts usually ends up with 80% of them at zero balance and 20% absorbing everything.
What mistake ruins every chart of accounts?
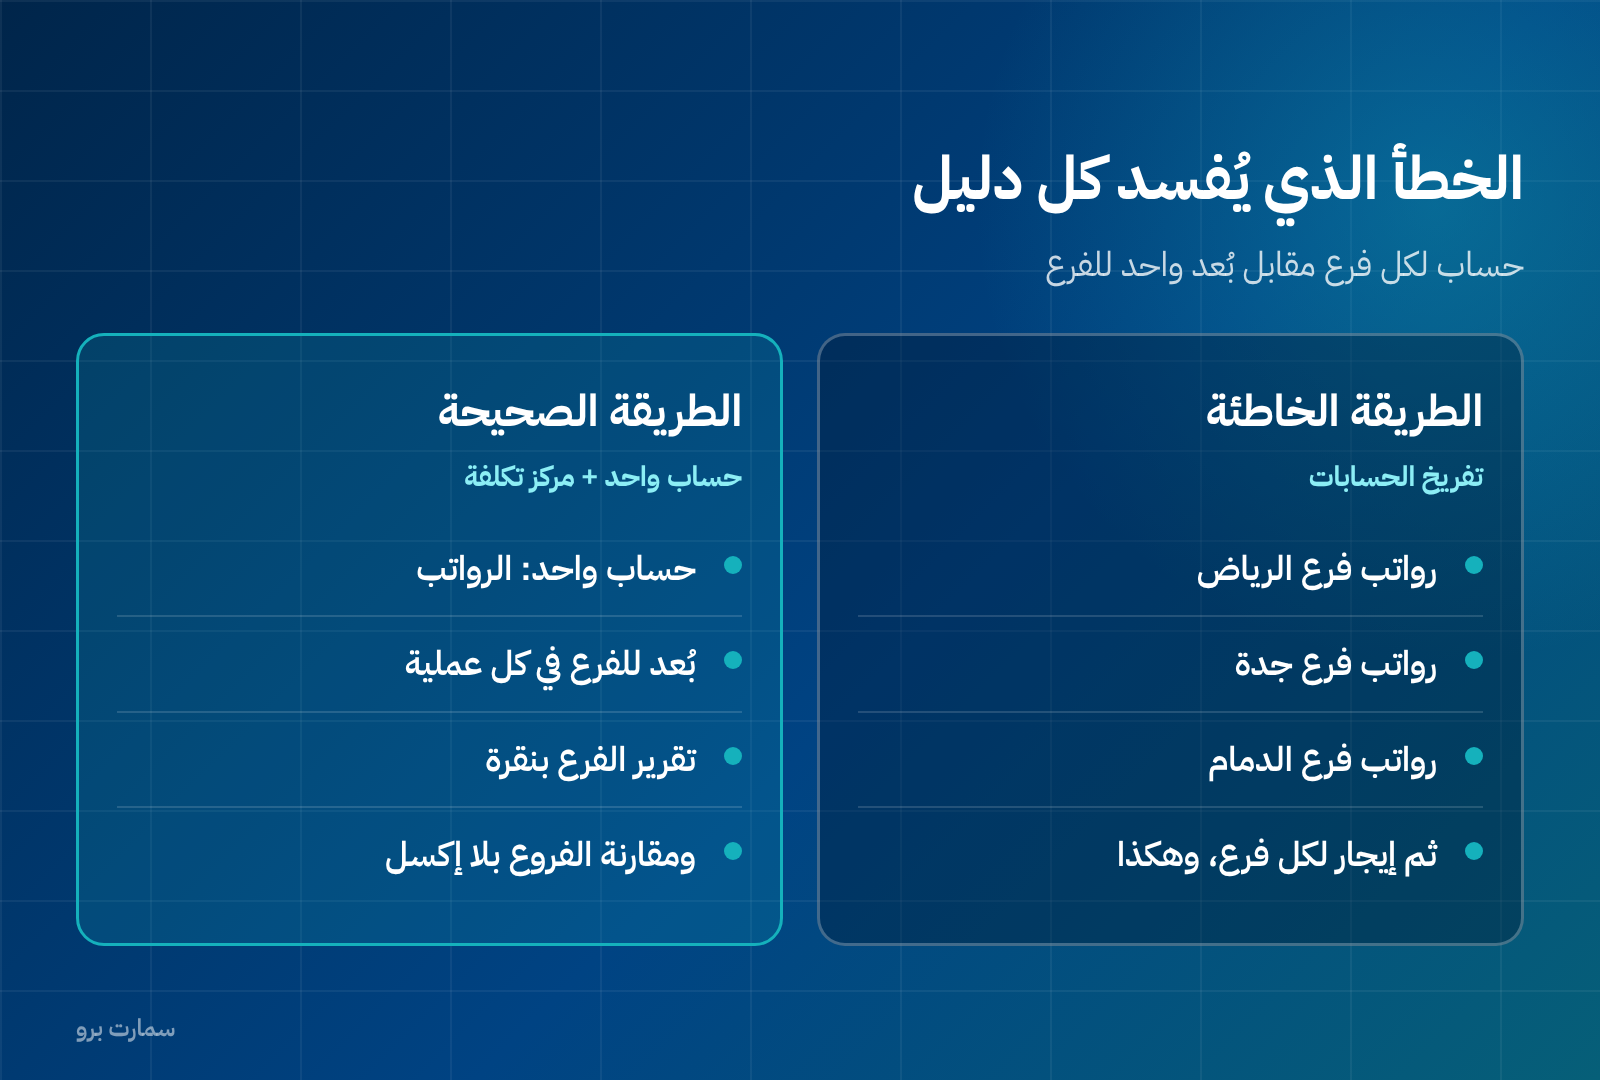
Creating an account called "Salaries – Riyadh branch", another called "Salaries – Jeddah branch" and a third called "Salaries – Dammam branch". Then rent for each branch, electricity for each branch, until the chart bloats and becomes unreadable.
The right approach is a single account called "Salaries", with a dimension or cost centre for the branch. You then get the full salaries report, a report for each branch, and a comparison between them, with fewer accounts and no mess. That's why the file includes a separate cost-centre sheet.
What are the contra accounts in the chart?
You'll notice accounts whose normal balance is the opposite of their group. This is intentional:
- Accumulated depreciation: sits under assets but has a credit balance, and is deducted from the asset's value.
- Allowance for doubtful debts: sits under assets and has a credit balance.
- Sales returns and discounts allowed: sit under revenue and have a debit balance.
- Personal drawings: sit under equity and have a debit balance.
Why should VAT accounts always be separate?
Output VAT payable sits under liabilities, and recoverable input VAT sits under assets. Two separate accounts, not one.
Merging them turns preparing the VAT return into manual work every period, and hides any problem on either side.
How do you build your own chart from this template in five steps?
- Write down the reports you want to read every month.
- Delete every account in the chart that doesn't serve one of these reports.
- Add what's missing, keeping to the numbering range of each group.
- Define your cost centres: branches, projects and departments.
- Limit permission to add new accounts to one person, or the chart will balloon within months.
How do you adapt it to your business without breaking it?
The template is generic by nature, so adapting it is expected. But stick to three rules:
- Delete what you don't need instead of hiding it. An account that exists but isn't used will one day be used by mistake.
- Add inside the range, not outside it. If receivables are 1200–1299, the new account takes 1230, not 1500.
- Don't put the branch or project in the account number. These are dimensions recorded in a separate field; otherwise your chart doubles with every new branch.
What numbering ranges are suggested?
| Group | Range | Examples |
|---|---|---|
| Assets | 1000–1999 | Cash 1100, Banks 1150, Receivables 1200, Inventory 1300, Fixed assets 1600 |
| Liabilities | 2000–2999 | Payables 2100, Output VAT payable 2300, Loans 2500 |
| Equity | 3000–3999 | Capital 3100, Retained earnings 3200 |
| Revenue | 4000–4999 | Sales 4100, Service revenue 4200, Sales returns 4900 |
| Expenses | 5000–5999 | Cost of sales 5100, Salaries 5200, Rent 5300, Depreciation 5800 |
Always leave gaps between numbers. Renumbering after your books are full of entries is a costly exercise that touches every historical report and year-on-year comparison.
Why are VAT accounts separated?
Separating output VAT from input VAT into two accounts isn't optional housekeeping. Without it, you'll add up the figures by hand every quarter when preparing the return, and you'll get them wrong. Add a third account for non-recoverable VAT on expenses so it doesn't get mixed with ordinary expenses.
Before adopting any VAT classification, check the details the Zakat, Tax and Customs Authority (ZATCA) requires in the return, and make your chart reflect them, not the other way round.
Read also
- Chart of Accounts: How to Build One for Your Business from Scratch
- Journal Entries: How to Write One Step by Step
- Trial Balance: What It Reveals and What It Hides
Try SmartPro your way
Start with a ready-made chart of accounts inside the system, then adapt it to your business, with real cost centres that give you the profitability of every branch and project in one click.
Request your SmartPro free trial and ask the team to review your chart of accounts before you enter your first invoice.
Article visuals
Frequently asked questions
What is a chart of accounts?
A chart of accounts is a numbered list of every account a business records its transactions in, divided into five groups: assets, liabilities, equity, revenue and expenses. It is the first thing built when setting up any accounting system, because every later report depends on how it is classified.
How many accounts does a chart of accounts need?
The number isn't the goal. Open a separate account only if you will read its figure on its own in a report or make a decision based on it; otherwise, a description inside the entry is enough. A small business may need only around forty active accounts.
How do I number accounts in a way that lasts?
Start each group with a distinct digit (1 for assets, 2 for liabilities, 3 for equity, 4 for revenue, 5 for expenses). Use at least four digits and leave gaps between numbers so you can insert a new account later without renumbering the whole chart.
Should I put the branch number inside the account number?
No. Branch, project and cost centre are dimensions recorded in separate fields, not parts of the account number. Putting them in the number doubles the size of the chart with every new branch and makes comparing branches harder.